My Job
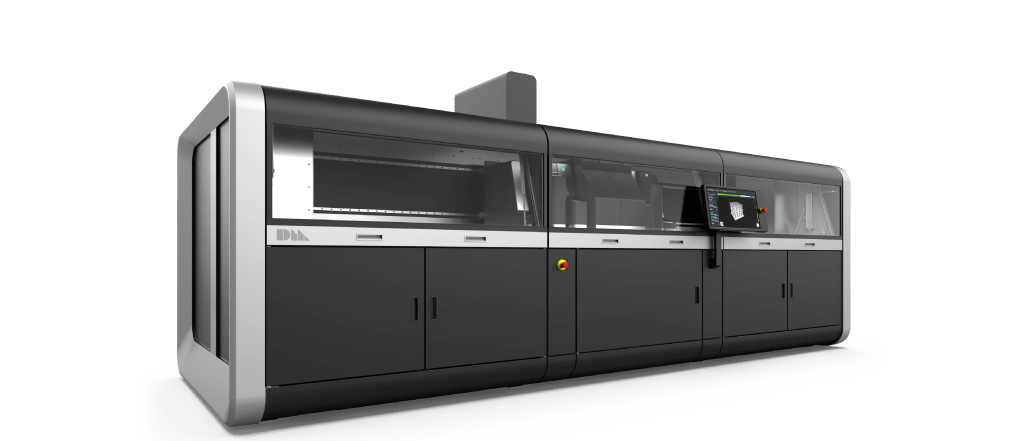
Much of my job was on the z-axis of the P-50 system. I worked on designing the dual stage actuation system, ensuring build volume alignment through tolerance stack-up led engineering drawings, and proper cart insertion. I also worked on developing a program to automatically plot the relevant data from the log files outputted by the Shop system.
Outtakes/Results
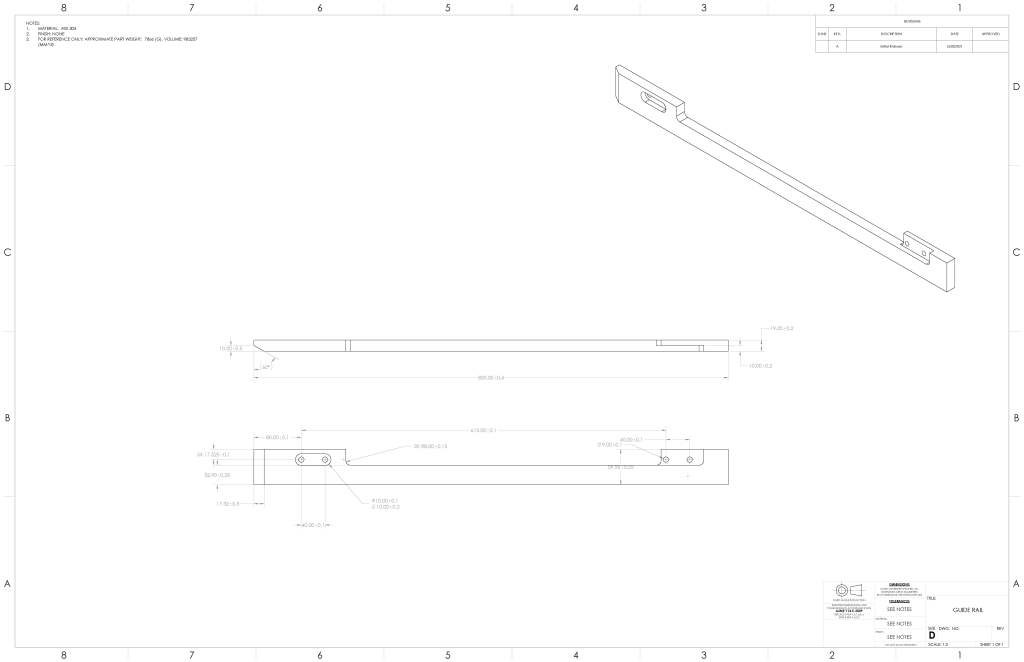
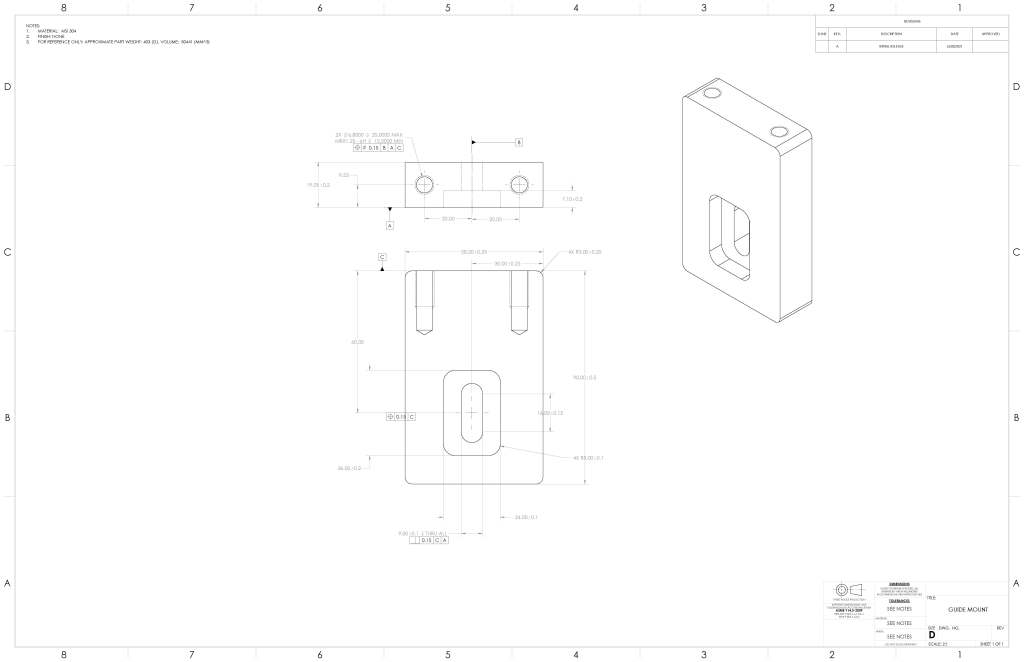
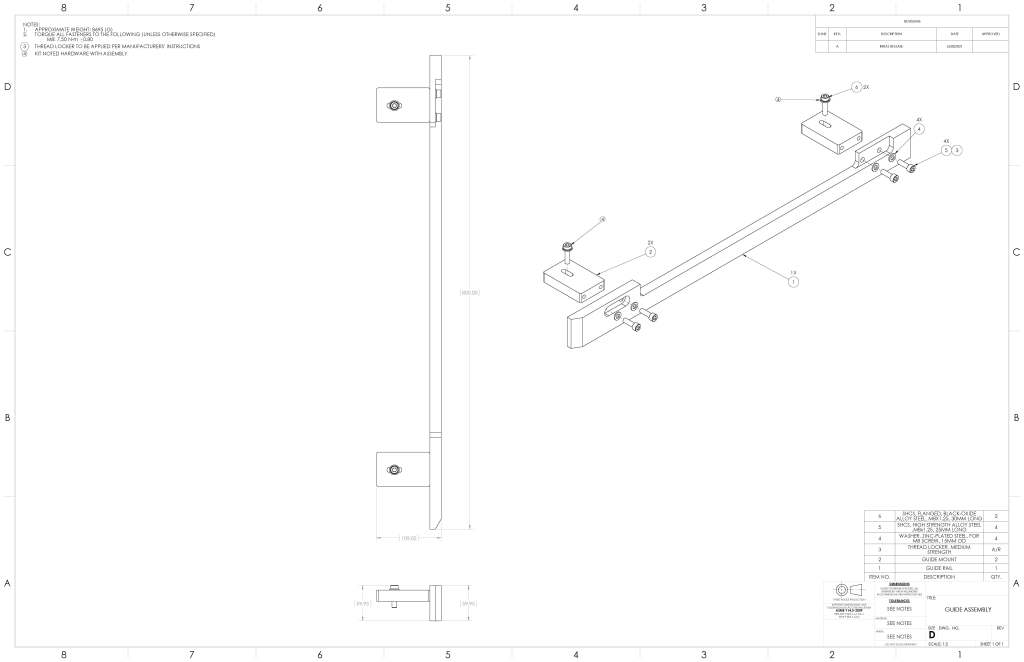
These drawings were a few of the ones that I did that I could take with me provided that I changed some of the dimensions and tolerances. These drawings in particular were for guiding the cart that inserted and removed the ~400lbs build box. I was responsible for this particular subassembly from conceptual drawings to final machining and assembly drawings. One key element of this design was that it could survive the impact that a rolling cart that weighed more than 400lbs couldn’t bend it (under normal circumstances) and would repeatably place the build box on the high precision kinematic mounting system that I worked on designing.
More Details
Z-Axis
- Parameterized tolerance stack-up of dual stage actuation to verify my selected actuators had the necessary accuracy and repeatability
- Designed kinematic mount system using canoe spheres and springs to repeatably align heavy build box and plate within a few thousandths of an inch
- Proved concept of canoe sphere alignment system using trailer hitches and angle iron alongside FEA
- FEA of the full P-50 system frame to understand how the loads from the Z-axis are going to affect the frame members on other high precision subsystems like the print head
- Redesigned complex machined sealing plate concept into single piece folded sheet metal and ran FEA simulations to verify strength and ensure proper seal was maintained through desired deflection
- Wrote a python script utilizing Pandas and Matplotlib to parse log files from the smaller Shop printers and plot the data in an easily readable fashion as these plots were need often and took a long time to do manually.
